
EMG Software
The Biometrics Analysis software is one of the most powerful yet cost effective EMG display and analysis software tools available. The most commonly used EMG data analysis is included - Rectify, RMS, EMG Work Done, Integration, Mean frequency, Median frequency, Power frequency.
Main Features
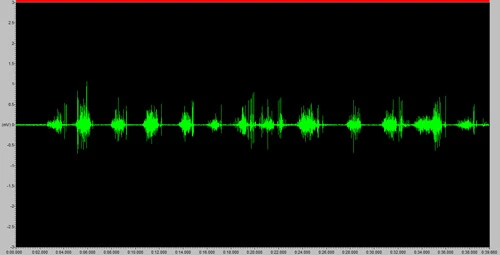
EMG Raw Data
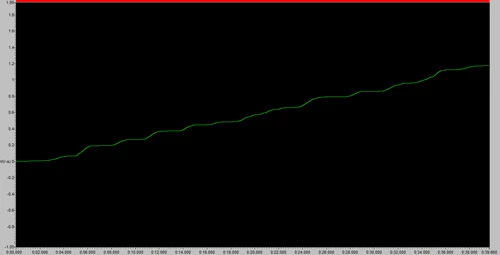
EMG Work Done
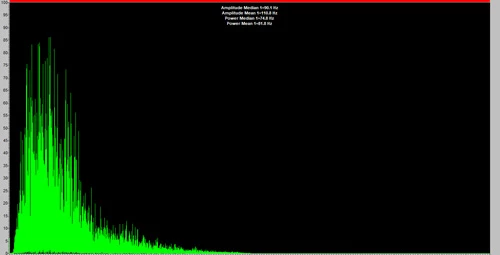
Frequency Analysis
As soon as a file is opened it is displayed as a raw EMG file and may then be subject to any or all of the features listed above. The data may be left as a whole or truncated into smaller files of specific data for further analysis. Of course not only EMG data may be displayed at any one time. The Y axis may be labelled with any units governed by what sensors were connected at the time of recording, e.g. Kg or lbs for force or degrees for limb movement. These units are then saved with the file and automatically compute every time the file is reopened.
The digital inputs are displayed on a separate graph to the analog inputs. Using this facility toe contact and heel off may be obtained using the contact switch assembly type no. FS4.
Once an EMG waveform has been obtained, it is often necessary to process the waveform to extract useful information. The type of analysis depends upon the application but the following guidelines may be helpful: